



Choose Your Country or Region
Select a different country or region to view content tailored to your location.

The Anatomy of Candlesticks
Introduction to Candlesticks
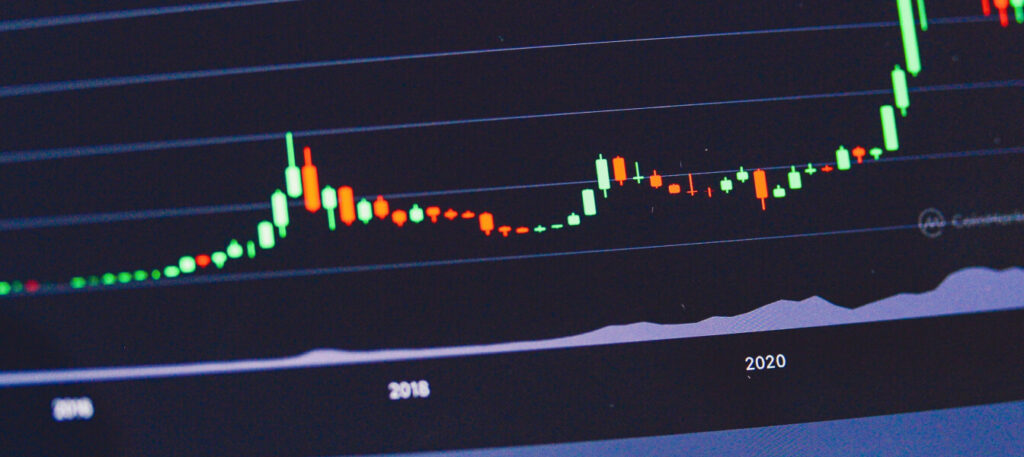
Candlestick charts originated in Japan over 100 years before the West developed the bar and point and figure charts.
Historical Background
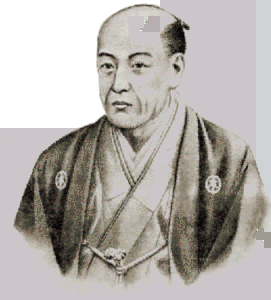
In the 1700s, a Japanese man named Homma discovered that while there was a link between the price and the supply and demand arise, the markets were strongly influenced by the emotions of traders. Candlesticks showed that emotion by visually representing the price moves with different colors. They also provide the quickest visual grasp of price action and the market sentiment behind it.
Candlesticks in Trading
Traders use candlesticks to make trading decisions based on regularly occurring patterns that help forecast the short-term direction of the price.
The Anatomy of Candlesticks
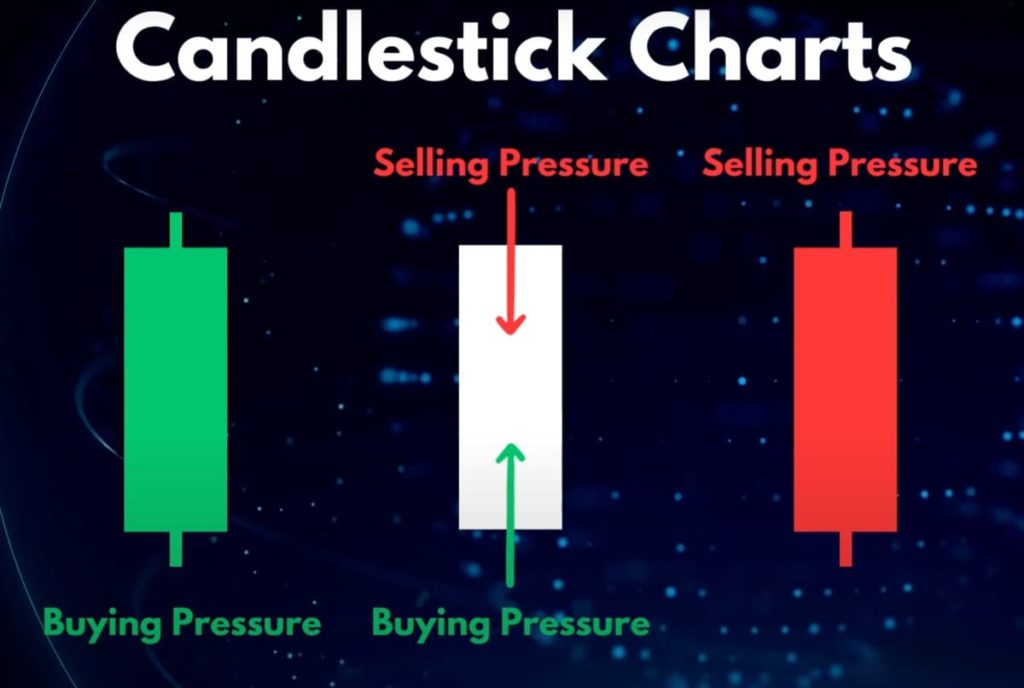
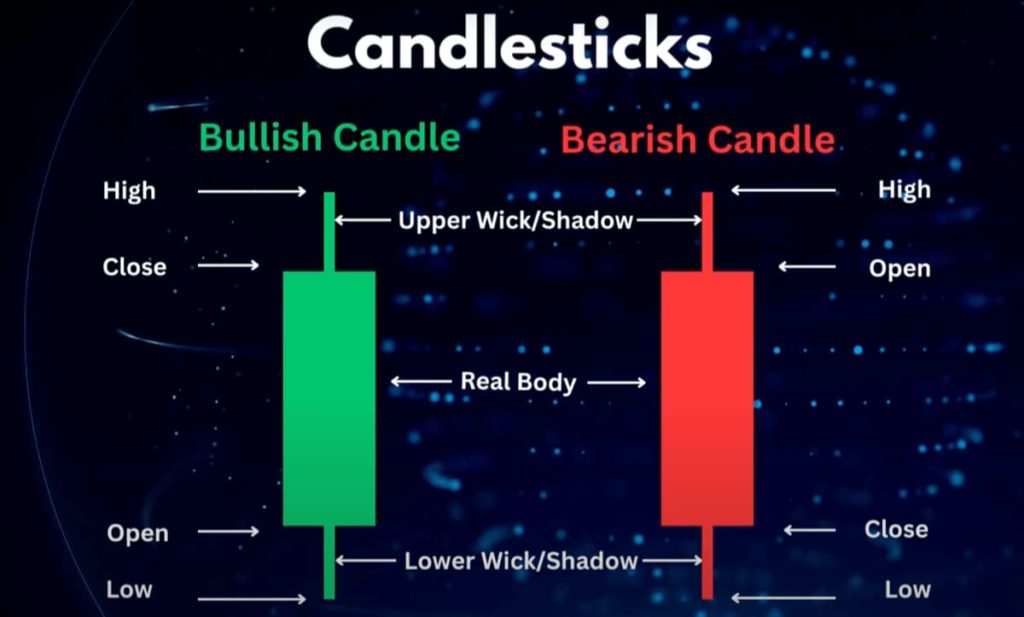
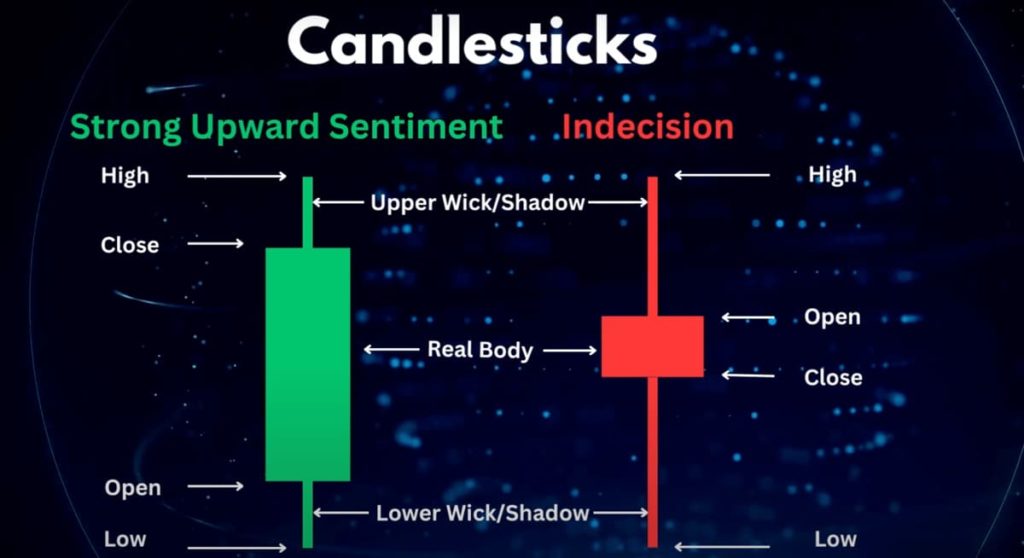
To read a book, you have to understand the letters to form meaningful words. Similarly, to read charts, we have to be able to read the candlesticks to perform meaningful patterns. Candles usually have a body and wick, also called a shadow, at both ends. The body represents the range between the open and closing price for a given period. The wicks or the shadows show the upper and lower price ranges.
Price Information in Candlesticks
Any of these individual parts may be missing from a given candle. Each candle displays all price information:
- The high of their period;
- The lower of their period;
- And the open and closing prices for a given period. The period covered by each candle depends on the time frame of the chart that you are viewing.
Time Frame of Candlestick Charts
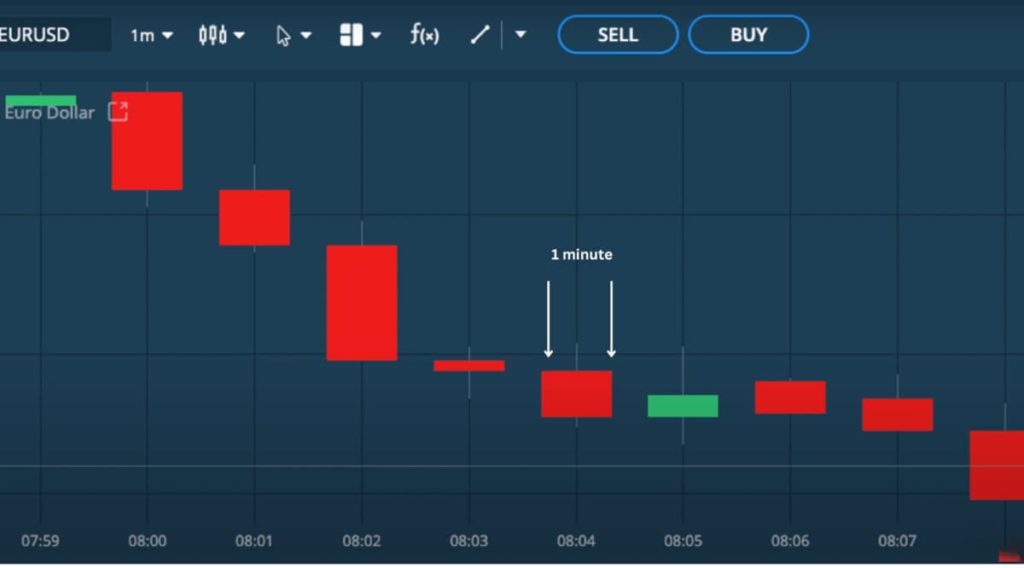
Each candle on a one-minute candlestick chart covers the opening, closing, and high and low prices for one minute, and similarly, each candle on a daily candlestick chart shows this price information for an entire day.
Color Coding and Market Direction
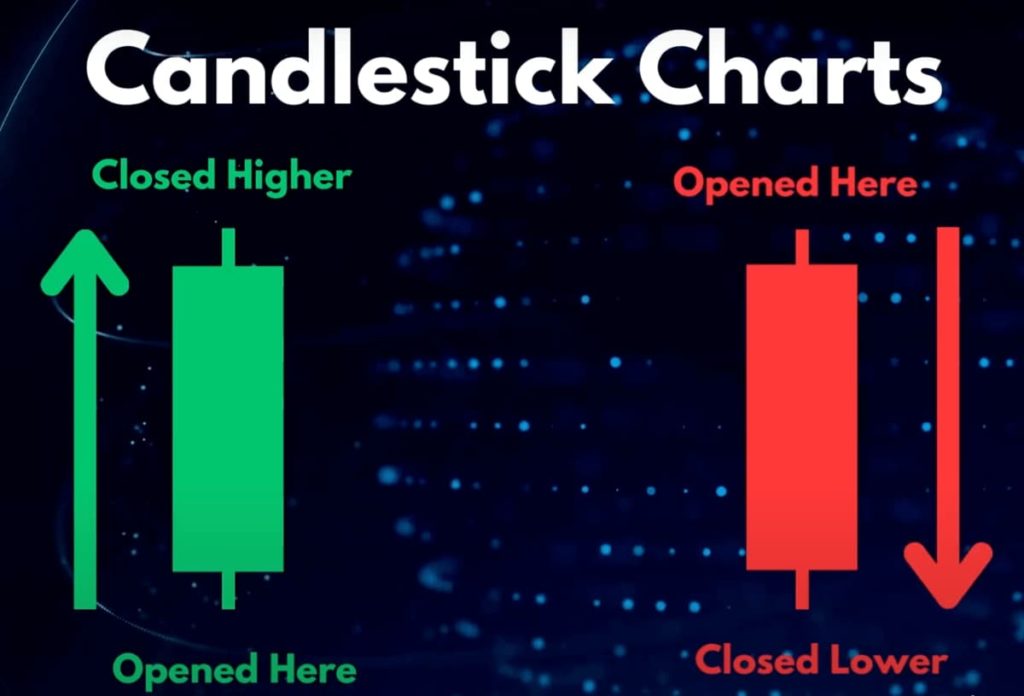
The color tells us the price direction for a given period. The most common color coding is green bodies for higher closes and red for lower ones. In this example, we'll continue to use green for higher closes and red for lower ones.
Analyzing Candlestick Body and Wick
What is the relationship between the body and the wick? The length of the body and the wicks, in absolute terms and relative to each other, can tell us a great deal about market sentiment over the duration of any given candle on a candlestick chart.
The Significance of Doji Candles
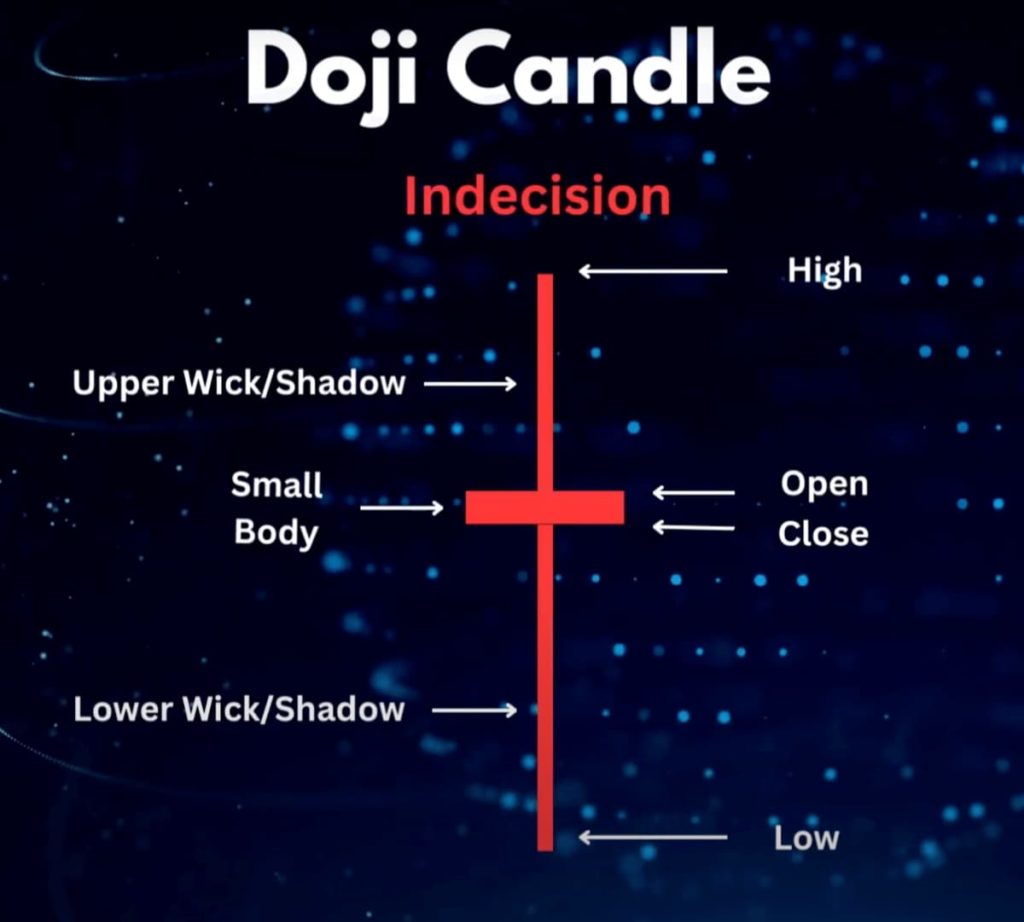
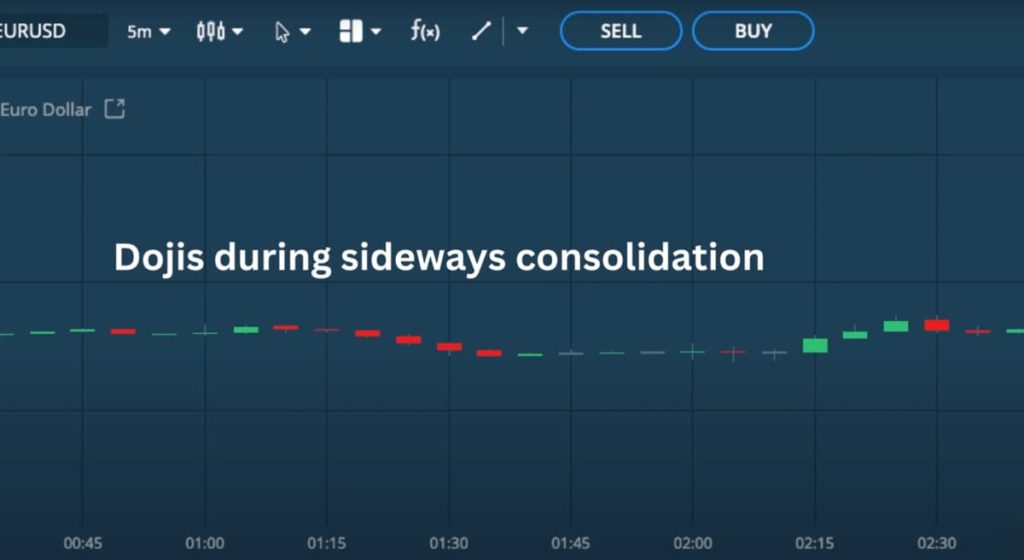
For example, let's take a doji candle. As you can see, the doji has a very small candle body, meaning that the opening and closing prices are almost the same. This indicates indecision about the price. The longer the wicks are relative to the body, the greater the indecision, and the greater the back-and-forth struggle between buyers and sellers.
Market Indecision and Doji Candles
The market simply couldn't make up its mind about the direction of the price. The market bounced around, and so the closing and opening prices were quite similar. When a doji occurs at the top of a strong move of, say, 5 to 10 green candles, this could signal a change in direction of the trend.
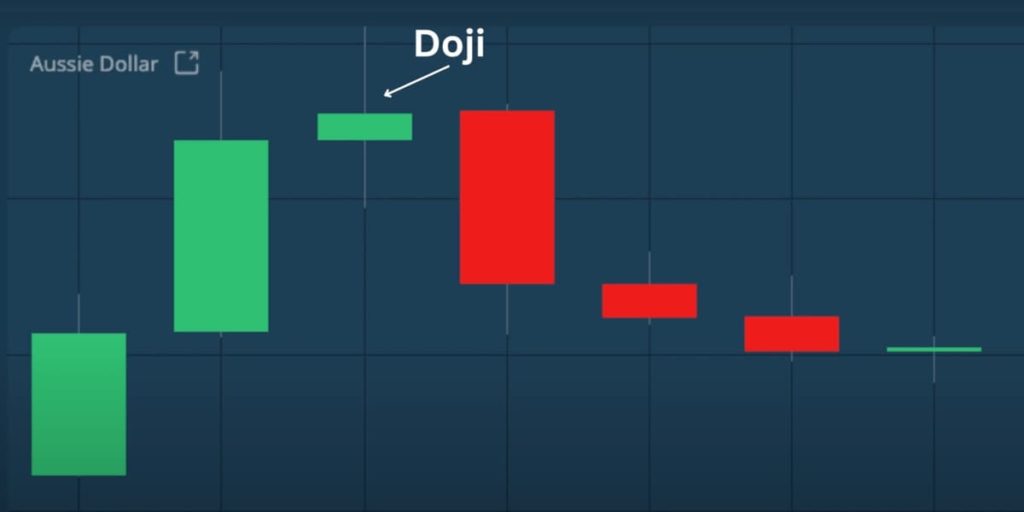
Dojis that occur during a period of sideways consolidation, however, are less significant because sideways price action really reflects indecision.
Understanding Long Body Candles
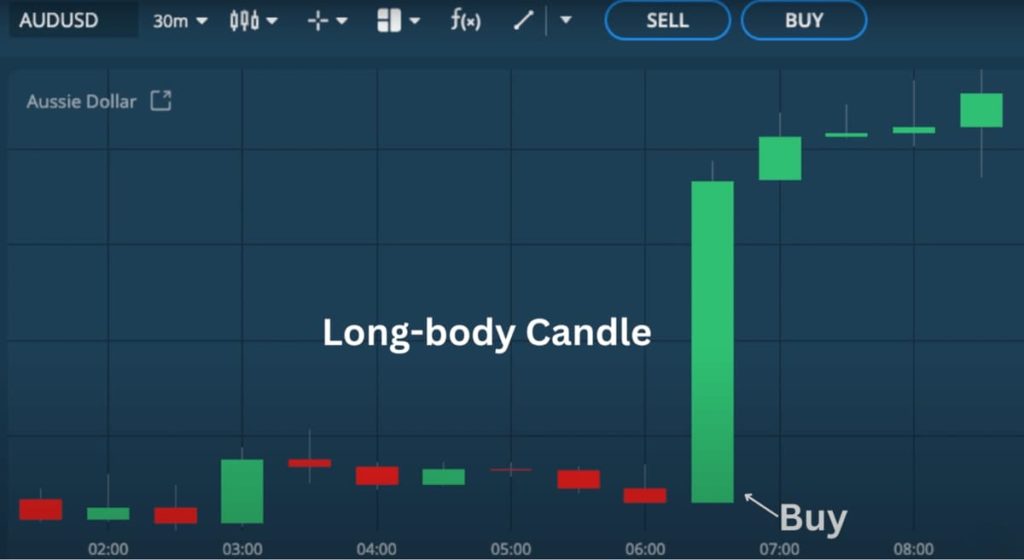
Another candlestick shape that is important to understand are long body candles. A long body candle is one which opens and surges up or down without ever-changing direction.
Candlestick Analysis as a Trading Tool
As traders, it is ideal to have an open position in the right direction, of course, at the start of these candles, but we seldom want open positions once these candles have been formed. Overall, candlestick products analysis can be a very powerful tool if used correctly.
Others Also Viewed
Explore more resources that fellow traders find helpful! Check out these other guides to enhance your forex trading knowledge and skills. Whether you’re searching for the best brokers, educational material, or something more specific, we’ve got you covered.

Best Brokers in Uganda
Discover the top Forex brokers in Uganda. Compare top platforms, fees and features to make an informed trading choice.
Forex Trading Platforms
Compare the best Forex trading platforms for 2025, including MT4, MT5, cTrader, and TradingView. Find the right tools to enhance your trading experience.

How does Forex Trading Work?
What is Forex trading and how does it work? An easy-to-read guide including how to trade, and how to choose a reliable broker.
Meet the Experts Behind Our Unbiased Reviews
Chris Cammack
Partner Manager and Financial Writer

Chris Cammack is partner manager and senior financial writer at FxScouts, specialising in broker relations and forex market analysis. As the former Head of Content (2019–2024), he set editorial standards for all content published at FxScouts, including broker reviews, broker comparison pages and education.
With over a decade of experience in editorial management and partner relations, Chris builds and maintains our relationships with our partners to provide the best Forex trading experience for our users.
He also co-hosts the “Let’s Talk Forex” podcast with Alison Heyerdahl, where he explores trading strategies, industry news, and macroeconomic trends to help traders navigate the markets with confidence.
Alison Heyerdahl
Head of Content

Stefan de Clerk
Financial Writer
