Compare Forex Brokers!
Compare top Forex brokers side-by-side and find the best fit for your trading needs. Start your comparison now!


Trading double tops and double bottoms are simple and very profitable. You only need a few tools to do this and it works across all time frames. Both the double top and the double bottom are indicators of upcoming trend reversals and a decrease in momentum. These patterns are easy to spot on a price chart.
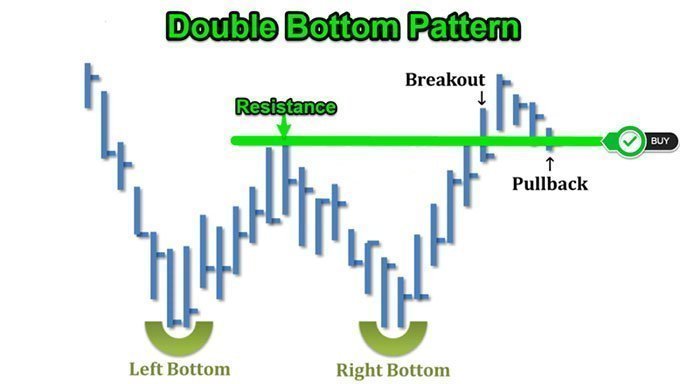
A double bottom is a bullish reversal pattern that develops around an important support level. This pattern will help you catch the beginning of a new bullish trend. This pattern happens frequently, it is easy to identify, and is seen in all currency pairs. The double bottom pattern begins with a downtrend which creates lower lows. But prices then retrace upwards, which creates the first bottom. After the retracement, the price moves lower again and retests the first bottom at exactly the same price level or within 2-4 pips of the first bottom. 
Open a long position either as soon as the price breaks above the resistance level or on a pullback. If the price breaks above the resistance line, as is typical in chart patterns, a past resistance level that was broken becomes a new support and the prices are expected to move higher. A protective stop-loss is usually placed below the double bottom. For a valid double bottom pattern to be confirmed, the difference between the lowest bottom and resistance level should be at least 10%.
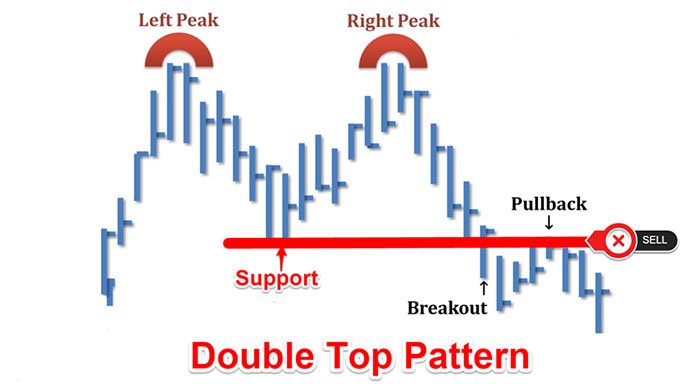
A double top is a bearish reversal pattern which forms after a strong move upwards. It appears as two consecutive peaks with approximately the same price. Spotting this pattern will help you to catch the beginning of a new bearish trend. The first set in confirming this pattern is to have an established bullish trend prior to the double top. This is important because the double top would otherwise probably just be two equal highs in a ranging market. In addition, the double top pattern is a reversal pattern, meaning that it has to have a prior trend to reverse. Secondly, the price needs a peak followed by a pullback to form a support level. Finally, after the first retracement, there must be a retest of the first peak at exactly the same price level or within 2-4 pips of the first bottom. All this before it reacts to a power price lower again. 
Open a short position either as soon as we break below the support or on a pullback. Only do this after the support level has been broken, and the double top pattern has been confirmed. A protective stop-loss order is usually placed above the double top pattern.
Understanding the psychology behind any price pattern will give you more confidence in trading it. The double top and double bottom patterns show the market mindset as you can see when other traders are in emotional or financial pain. These patterns work because traders wait for proof that a support or resistance level is holding before they execute a trade. After the double top or the double bottom pattern has formed, it becomes more clear for everyone that a support or resistance level has formed, and thus traders are willing to execute trades. The double top and double bottom patterns quite often will provide trading opportunities with a low risk-reward ratio. This will ensure that your losses are always smaller than your winners.
Explore more resources that fellow traders find helpful! Check out these other guides to enhance your forex trading knowledge and skills. Whether you’re searching for the best brokers, educational material, or something more specific, we’ve got you covered.